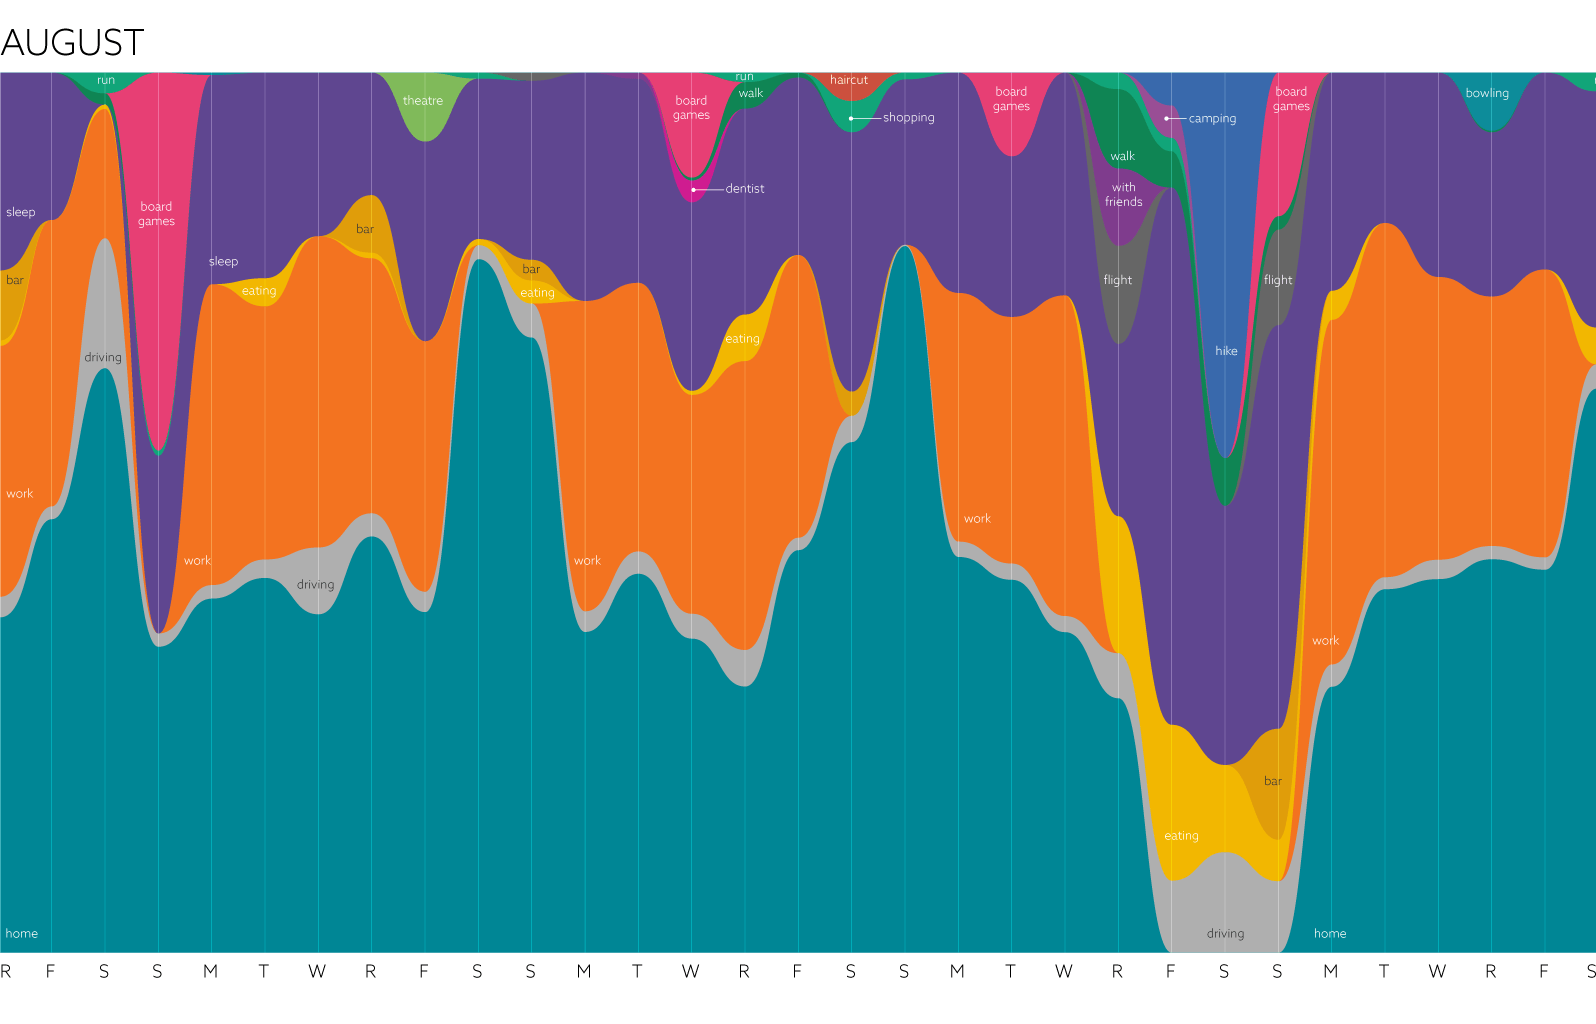
A project at work prompted me to begin tracking my daily activities to help infer a few design decisions. I was able to automate this process by using the app Life Cycle which tracks your location and infers what activity you are doing based on those locations. It also exports to .csv which is great!
From there I was able to plug that data into one of my favorite online tools: RAWGraphs. RAWGraphs is an online graphing app that not only has a lot of interesting graph types, but also exports to .svg which allows me to add finishing touches to the graphs in Illustrator.
The resulting graph is a month long view of the change in ratios of daily activities. Weekday and weekend routines are made evident here. See if you can guess when I went on vacation.
Programs used: Life Cycle, Rawgraphs.io, and Adobe Illustrator.

